Ladder
The ladder diagram displays the flow of packets amongst the segments represented by the capture sources, along with information such as timing.
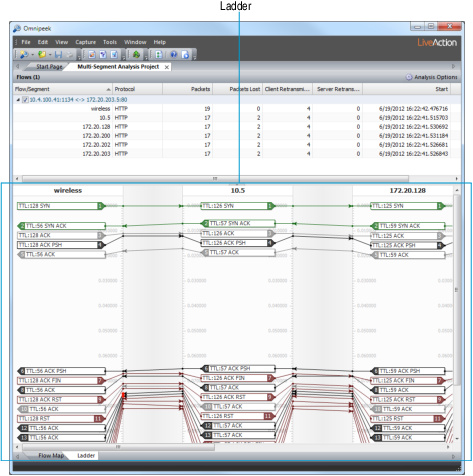
Ladder viewing tips
Here are some useful tips when viewing the data inside the ladder diagram:
• Hover over packet boxes to view tooltips displaying more data.
• Arrows show the direction in which data flows.
• Green boxes are the packets that open the flow (SYN and SYN-ACK).
• Black boxes are packets with non-zero payload (packets that carry data).
• Gray boxes are packets that have zero payload (probably just ACK packets).
• Red boxes are packets that close the connection (FIN or RST).
• Right-click inside the diagram to show/hide additional statistics, or to adjust the time scale of the ladder.
• The following keyboard/scroll wheel shortcuts are available from the ladder display:
• Wheel+Ctrl: Changes the time scale.
• Wheel+Ctrl+Shift: Zoom the time scale.
• Wheel+Ctrl+Shift+Alt: Change the segment width.
• Ctrl+Alt+Shift+F9: Save ladder display to text.